Matrix function
Applies to JungleDocs for Office 365.
For JungleDocs for SharePoint 2010-2019 tutorials, click here.
In JungleDocs for Office 365, you can use the Matrix function for statistical data transformations. In this tutorial, you will learn how to do this.
This function achieves statistical data transformations using data from grouped lists.
Command syntax forms are:
Matrix(listName; viewName; formula)- listName - SharePoint list name
- viewName - SharePoint view name
Matrix(listName; viewName)Matrix(items; formula)- formula – optional parameter. It will do some statistical data transformation with grouped list items. You can access grouped list items using parameter $Items. By default, the formula is set to "Count($Items)". Count command will return the number of items.
Matrix(items)- items – you can specify any formula that will return a grouped list.
Using Matrix function with grouped lists
- For example, if you have a grouped list, enter a command in the Excel template cell:
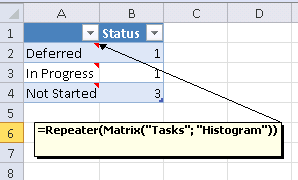
=Repeater(Matrix("Tasks";"Histogram")).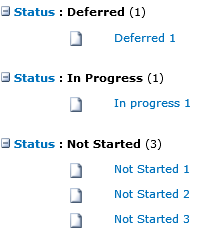
- The result will be a transformed table:
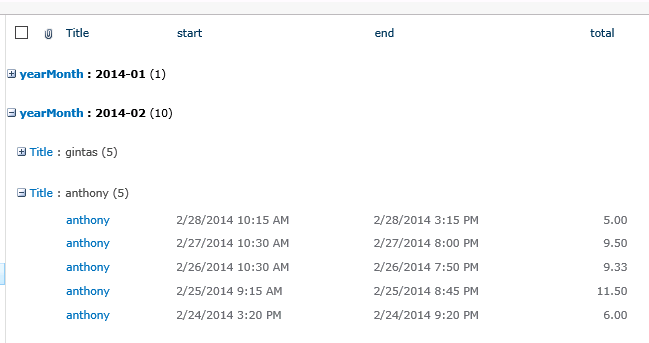
This command also supports 2 level grouping. Matrix rows will come from the first level of grouping and matrix columns will come from the second level of grouping. Cells will be the formula’s result.
- For example, we have data like this:
- We can use the Matrix function to get a result like this:
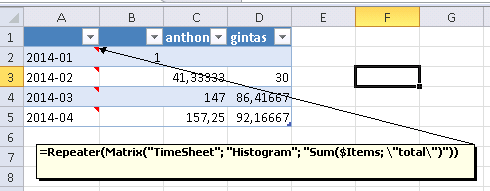
The Sum function here will calculate group items by total field. This Excel data also can be used in Word charts.